
Foresight - Summer 2024
- A.F.T. Trivest
- Jul 1, 2024
- 8 min read
Global equity markets had a very strong end in 2023 and continue to be the major driver of portfolio returns over the first five months of 2024. The following table is a sample of some of our larger equity sector ETF returns YTD and twelve months to May 31st.
Exchange Traded Fund returns to May 31/2024 | 12 months | Year to Date |
BMO Low Volatility Canadian Equity CAD (ZLB) | 8.3% | 4.5% |
Wisdomtree US Total Return Dividend USD (DTD) | 22.5% | 8.1% |
iShares Japan Fundamental Index CAD (CJP) | 45.5% | 24% |
iShares MSCI Europe Index CAD (XEH) | 17.8% | 14.8% |
iShares Global Technology USD (IXN) | 38.5% | 13.9% |
CI Munro Alternative Global Growth CAD (CMAG) | 34% | 22% |
CI Munro Climate Leaders CAD (CLML) | 56.2% | 44.8% |
While markets have been very strong overall, there are always leaders and laggards! Over this period, the technology, energy, metals, and industrial products sectors have been leaders, while Canadian banking and utilities sectors have been the laggards. Utilities sector valuations have been under pressure due to the significant rise in interest rates. Going forward, this sector will benefit from growth in earnings and any declines in interest rates. Canadian bank shares have suffered from increased loan loss provisions due to higher interest rates. Although the “Big Six” Canadian banks provisioned a combined $4 billion in their recently reported Q2 results, they still earned a combined total of $13 billion. If loan losses come in below what was provisioned, there will be double positive impact to earnings as the losses are added back just when earnings growth is likely to accelerate in the next economic cycle.
The inside article examines bond portfolio under-performance which, albeit, climbed slightly in the first months of the year. With inflationary pressures slowing (April CPI came in at 2.7% in Canada and 3.4% in the US), fear of another rate increase is abating. The US economy remains stronger than Canada, yet the Bank of Canada was first to cut rates, by 0.25 of 1% to 4.75%. Canada’s rate cut before the US could put pressure on the Canadian/US$ exchange rate. This should be positive for portfolios with US$-valued investments. The cut also will decrease bond yields, with a corresponding positive impact on the prices and returns of existing bond portfolios.
We are very pleased to announce that Michael George successfully completed his studies to earn the prestigious designation in the finance world: CFA.
Fixed Income: Friend or Foe?
As we wrote on the back page…”Fixed income annual returns have languished, returning negatively from July 2021 through February 2023, then hovered around 1 1/2% through March 2024 (with a brief spike in December through February).” With portfolios typically holding 40% fixed income, the overall portfolio returns bear significant drag with such low fixed income returns. Accordingly, we turn our attention here to review this asset class.
Fixed income securities provide a return through fixed periodic interest payments and the eventual return of principal at maturity. They are considered a defensive asset class given that they are typically less volatile than some other asset classes, such as equities, and thus they are utilized in portfolios as a source of diversification to help reduce volatility and overall portfolio risk. The global bond market is significantly larger and has a much wider array of securities than the global equity market… something that is easy to overlook, given how much focus is on the global equity markets.
As investors, we may seek some, or all, of the following characteristics from a bond portfolio:
Regular cash flow to buy the groceries | Safety of capital/bond rating | Rate-of-return |
One-off cash flow to buy a new car | Maintain purchasing power through inflation | Low transaction costs |
Access to cash for strategic rebalancing | Re-investment risk:laddering maturities | Liquidity/tax smart |
Although bonds are the most common type of fixed-income security, there is a wide universe to choose from, each with its own unique benefits/risks: GICs, term deposits, semi-annual pay, strip bonds, corporate/government borrowers, investment grade vs “junk bonds”, ETF baskets, real-return inflation protection, high-interest savings and alternate-debt instruments, including preferred shares.
The fixed income side of our portfolios is largely allocated to Canadian government bonds, with a smaller allocation to US Treasury bonds (adding foreign currency diversification/risk) and to alternative debt securities (which offer a higher risk/return profile). Approximately 85% of our fixed income portfolio is allocated to bond exchange-traded funds (ETFs), which are baskets of bond holdings that reflect some theme. They allow us to efficiently and cost-effectively manage our targeted exposure to these themes, such as duration, maturity ladder, credit risk, etc. Our largest bond ETF holding (45%) is the iShares 1-5 Year Laddered Government Bond Index (CLF) whose theme is a well-diversified government bond portfolio with 60% in Government of Canada bonds and 40% in provincial government bonds, all with laddered maturities from 1 to 5 years.
Rising interest rates in Canada over the last few years have increased investor interest in High-interest Savings Account ETFs (HISA) and Guaranteed Investment Certificates (GICs). HISA ETFs and GICs are often compared, as both pay interest connected to prevailing interest rates; however there are a few key differences. When you purchase a GIC, the interest rate is “locked in” for the entire term, whereas the HISA ETF yield changes as interest rates change. Further, liquidity is a key consideration since you must hold GICs until the term ends whereas a HISA ETF trades daily on an exchange and can be sold with a one-day settlement period. A third consideration is that amounts held in a HISA ETF are not covered by federal deposit insurance while GICs are covered (up to $100,000 per account). We use both HISA ETFs and GICs within fixed income portfolios (12%); however we continue to prefer bond ETFs, given their higher liquidity (relative to GICs) and expected outperformance in a falling yield environment.
As mentioned above, we allocate approximately 10% of our fixed income portfolio to alternative debt (Alt-D), which is non-government fixed income securities. Alt-D offers an opportunity for higher returns, but also brings more risk and more volatility. There are many Alt-D instruments in the market-place, but our largest Alt D holding is the Neuberger Berman Specialty Finance Income Fund. This private debt fund focuses on North American self-liquidating consumer and small business loans with short duration and steady cash-flow. It is comprised of thousands of underlying loans diversified across sectors, geographies and other factors. With an average duration of 1.5 years, it’s short duration and amortization lead to low correlation to the overall fixed income markets, which helps us achieve greater diversification in our fixed income portfolio.
Over the recent prolonged low interest rate environment, we determined that we were not being paid enough in the long maturity end (30 years) of the bond market to justify the price risk to the bond portfolio, given even a moderate increase in interest rates. The low interest rate cycle ended in March of 2022 with the first Bank of Canada moderate rate increase from .25 of 1% to .5 of 1%. Then rates dramatically continued to rise to 5% over the next 16 months. This rapid increase in interest rates and bond yields caused the aforementioned underperformance by this asset class.
Although the low interest rate cycle lasted far longer than we would have expected, our patience was rewarded as the long end of the bond market was severely impacted by this dramatic increase in both Canada and the US. Over that period, the iShares 20+ Year Treasury Bond ETF (TLT) dropped more than 40% in value and Canadian Long Bond ETFs - the BMO Long Provincial Bond Index ETF (ZPL) and the BMO Long Federal Bond Index ETF (ZFL) - were both down 30%. Meanwhile, CLF (1-5 year bond ladder) was down only 5%. Furthermore, in an upward-moving interest rate environment, a 5 year bond ladder has the advantage of one-fifth of the portfolio turning over every year to enjoy the new higher re-investment rates, vs. only one tenth for a 10 year bond ladder and one twentieth for a 20 year bond ladder.
With interest rate increases plateauing and, in anticipation of future interest rate cuts after a 10 year period of strategically maintaining a very short duration bond portfolio, in February 2023 we made our first foray into the long end of the bond market. Over the past year we have re-allocated approximately 20% of our fixed income portfolio to longer duration bonds, which will benefit from falling interest rates far more than short duration bonds. Our largest long duration ETF bond holding is ZPL (15%), which provides exposure to Canadian provincial bonds with maturities greater than ten years. As a comparison, the weighted average duration of ZPL is 14.27 years vs. 2.52 years for CLF.
Although we don’t expect interest rates to fall back to the near-zero rates of 2021, even a moderate decline in bond yields can see long bond prices producing low double-digit returns over the next few years. Furthermore, if the Bank of Canada and US Federal Reserve hold interest rates at these levels for too long, pushing our respective economies to recession, corrective interest rate cuts will be even deeper, resulting in even better returns for long bonds. When bond yields look to have bottomed in the next economic cycle, we will sell the long bonds and return to the 1-5 year bond ladder.
Looking forward, our bond ETFs have current yields-to-maturity ranging from 4.24% to 4.98%. The HISA ETF currently has a 4.89% yield, while GICs are yielding close to 5% for one year, declining to 4.2%-4.5% through to five years. Compared to the opening statement in this article of 1 1/2 years of negative returns, this current rate environment for fixed income will have a significant positive impact on portfolio returns going forward.
As stock markets continue to run, we may see a period of returns where these two components that constitute a portfolio amplify, rather than mitigate, each other.
Investing Update
In the Winter issue, we updated investment returns to last September 30, 2023. We roll forward here for the following six months to March 31, 2024. A year ago, we had experienced nine rolling twelve-month periods with negative portfolio returns (from -0.58% to –5.24%). The subsequent six rolling returns to September 2023 all turned positive (from 1.5% to 8.59%). That trend continued for the recent six months to March 31, 2024 (from 3.11% to 9.24%).
Fixed income annual returns have languished however, returning negatively from July 2021 through February 2023, then hovering around 1 1/2% through March 2024 (with a brief spike in December through February). Meanwhile, stock markets have been on a tear for the last twelve months (ranging from 2.76% to several periods of double-digits). The stock market returns of dividends-plus-appreciation have contributed no less than 70% of portfolio total return, and as much as 100%, over the last twelve months (averaging 90% over that period).
Rolling one year returns for fixed income have been negative for approximately half of the last 39 months, versus only eight times for equities. With asset allocation strategies commonly holding 40% fixed income and 60% equities, the drag of abysmal fixed income returns for the last three years bears heavily on overall return (though only 9 negative periods).
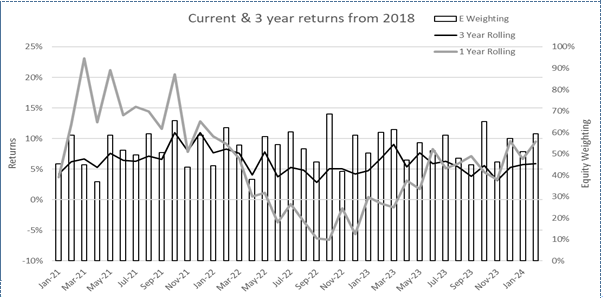
The daily or monthly Market watcher may get mired in these short term perturbations, even as they cancel each other out. Compound return data are a good antidote! At Trivest, we have been calculating and reporting returns and compound returns for 30 years. Even a short three-year statistic is insightful. Nobody would dare to call three years “long term”, but nonetheless, a lot of history can happen in just three years. Annual, simple returns over any three year period can vary a lot, bending to the news of the day. But historical data analysis shows that equity down-drafts tend not to be very long-lived. So even that short three year compound stat can smooth out a climb up the Worry Wall. For instance, the light line graph (using the left scale) shows the rolling one-year returns for sample files from January 2021 to March 2024. These returns range from 23% (post-Covid recovery) to –7%. The dark line graph shows the annual compound returns encompassing rolling three year periods. The band of these returns runs mostly between 4-8%, with two spikes significantly above that and two minorly below that. The one-year volatility above of –7% to +23% shrinks to 4%-8%....the latter of which is consistent with historical long term returns.
The bar graph (on the right scale) shows the equity proportion of the portfolio. With the different equity proportions, the rolling three year returns are not directly comparable. For most of the data points, higher (equity proportion) bars led to higher lines, as equities have outperformed bonds, as discussed above.


Comments